Return to Sales Model Overview.
This report shows financial data and amounts for sales processes that are stored in the Sales Planning cube. It focuses on planning figures for several years (mid-term planning) and can perform the following planning functions:
- Copy the most recent planning version
- Increase or decrease figures by self-selected percentage values
- Delete existing values online
Amounts can be shown in local currency or converted into one of the target currencies.
Report Heading
The screenshot below shows the heading area of the Sales Mid-Term Planning report. The report heading updates dynamically as various reporting options are selected. The logo can be changed in Administration; see Configuring Design Elements for more on report design.

The heading area of the report displays the following fields:
|
Field |
Description |
Implementation |
|
Title |
Name of the report |
Name of the report in Report Designer |
|
Subtitle |
Current PoV selection |
Localized subtitle will update as PoV selections are made |
|
Arrow |
Toggle PoV widget |
Click on the arrow to display or hide point-of-view selections |
Point of View (PoV) Options
The content of the report can be customized using the PoV options, which can be viewed by clicking the blue arrow at the top of the report. ![]()
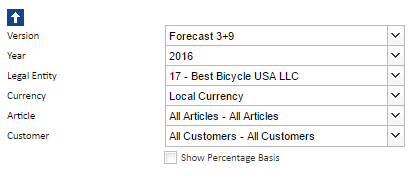
The available options are described below:
|
PoV Option |
Description |
Implementation |
|
Version (Combobox) |
Select a version |
|
|
Year (Combobox) |
Select a reporting period |
Elements matching the pattern |
|
Legal Entity (Combobox) |
Select one single legal entity or any consolidated element |
|
|
Currency (Combobox) |
Select local currency or one of the target currencies. The selection of local currency is only available if the selected |
Elements of
|
|
Article (Combobox) |
Article shown as localized name |
|
|
Customer (Combobox) |
Customer shown as localized name. |
|
|
Show Percentage Basis (checkbox) |
Show input area for percentage value to increase or decrease planning data. |
Input field will be locked or unlocked depending on checkbox selection. |
Report Columns
The columns displayed in the report depend on the selections made in the PoV area. The screenshot below shows a report displaying Forecast 3+9, with the Percentage Basis Row enabled and the planning helper functions expanded.

Below are descriptions of the columns in the Sales Mid-Term Planning Report.
| Column | Description | Implementation |
|
Row label |
Account shown as localized name |
Preselected global Subset SalesPlanningMidTermPlanningSales of Sales Planning_measure dimension, implemented with hierarchy filter and pick list manager. |
|
Area visualization of version |
Fill and border style for version |
|
|
PY |
Previous year value |
|
|
FC x+y |
Forecast x+y value, the most recent forecast |
Element of the |
|
Input cell percentage value |
Manual input for percentage value |
Input field for self-selected percentage value (planning helper functions) |
|
yyyy |
Manual input, including planning helper functions. |
Data validation with planning helper functions:
|
|
ΔFC x+y% |
Percentage change of Forecast x+y to Previous Year |
(FC x+y – Previous Year) / Previous Year |
|
Δyyyy YOY% |
Percentage change |
(Mid-Term Planning yyyy+1 – FC x+y) / FC x+y |
|
Δyyyy YOY% |
Percentage change of Mid-Term Planning II to |
( |
|
Δyyyy YOY% |
Percentage change of |
(Mid-Term Planning yyyy+3 – Mid-Term Planning yyyy+2) / Mid-Term Planning yyyy+2 |
Cell Locking
Cell locking prevents the entry of data in fields that draw on multiple sources. For all planning reports, data entry is only possible when a single legal entity and the local currency are selected.
Every account in the Sales Planning_measure dimension contains the PCalculation attribute, which defines the rule that is implemented on the element. When information is deposited in these attributes in the form of a B Rule, or the selected element is a C Element, cell locking is activated in the planning reports and data cannot be entered.
In the Sales Sales Mid-Term Planning report, it is possible to input data in years. Columns where data can be input are indicated with horizontal stripes:  The area where data entry is possible is indicated by a gray box
  as indicated in the screenshot below:
Updated November 4, 2024