Jedox Cloud Console offers two important sections for administrating your cloud instances: Statistics, to keep track of memory and storage usage; and Services, where you can monitor and restart your cloud environments. This article explains in which scenarios these actions are recommended.
Statistics
This section displays real-time information about the resource usage of the cloud instance, including CPU and memory usage graphs. You can switch between CPU Usage and Memory Usage by clicking on the respective icons.
There are four tabs for displaying different time frames of the graphs, i.e. for the past one hour, the past 24 hours (default view), the past 7 days, and the past 30 days. You can also display a larger time frame by double-clicking on the graph, or zoom in on a specific time frame by dragging and dropping the mouse.
When you download the Uptime Report, you can access the usage reports for the current and previous two months. Listed there, among other things, is your monthly server availability as a percentage.
The reports are downloaded as a zip file in .csv format.
To review these reports on Jedox Excel Add-in without formatting problems, follow the steps below:
-
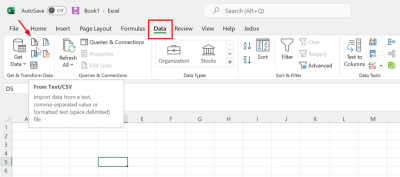
Open Jedox Excel Add-in and select the Data tab. On the Get & Transform Data section, click the icon indicated below ("from Text/CSV"
 ):
):
-
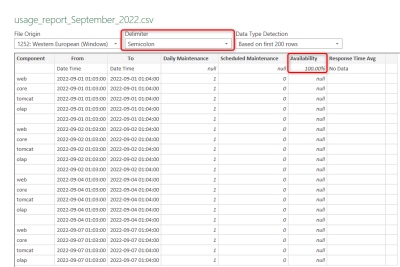
Choose your csv file from the dialog and click on Import. Then, in the next dialog, select semicolon for the delimiter option. Click Load

Services
This section controls the status of each service individually by providing buttons to stop / start / restart each service individually. You can also restart all active services at once via the "Restart all" button.
The various services are described below:
 Spreadsheet Server
This service handles the data in workbooks.
When to Stop & Start or Restart
- When encountering performance issues: reports take too long to load, screen freezes, etc.
 Web Frontend
This service is an extended Apache Webserver, containing the program code for the Graphical User Interface (GUI). This service can only be restarted.
When to Restart
- When the instance freezes (keeps loading).
- If general errors appear (e.g. http 500)
 Web Backend
This RPC service handles the data of Scheduler jobs, besides serving as the general backend for Jedox.
When to Stop & Start or Restart
- When the instance freezes (keeps loading) or is slow.
- Restart if the following error appears in an Integrator component:
Code: R1 - ETL server Exception occurred! Could not connect to Integrator server. Please restart tomcat-rpc, logout and login again. - If “Marshalling error: null” appears.
 Views
Views
This service handles the Views Middleware server. Available only for the latest Jedox version 23.3 or higher.
When to Restart
-
When encountering performance issues: Views take too long to load or freeze, etc.
 Integrator
This service provides the functionality of Jedox Integrator (ETL).
When to Stop & Start or Restart
- When the Jedox Support Team performs a modification on a configuration file, such as config.xml.
- If “Marshalling error: null” appears.
- If you receive communication or timeout errors. You can increase the Integrator timeout value in the Jedox Web Settings manager with the key integrator.proxy.timeout. You should logout, restart the service, and login again after setting a timeout value.
 OData Hub
Cloud-based service that allows third-party systems to process Jedox information on demand. It provides a scalable, powerful approach for integrating Jedox data dynamically with other corporate tools.
When to Stop & Start or Restart
- When the Jedox Support Team modifies a configuration file.
- If you experience communication or timeout errors in third-party tools.
- When encountering performance issues on Jedox data retrieval in the third-party tools.
 Cache
Cache
Contains temporary data to improve performance, including user sessions.
Restarting the service will cause users to be logged out.
Updated November 4, 2024

